MATLAB display certain vertex indices
Alec Jacobson
July 09, 2010
When I'm prototyping with meshes in MATLAB it is often useful to plot the meshes in 3D.
Then I might want to examine individual vertices. So say I have defined vertices V and faces F:
[x,y]=meshgrid(1:10,1:10);
z = peaks(size(x,1));
V = [x(:),y(:),z(:)];
F = delaunay(x,y);
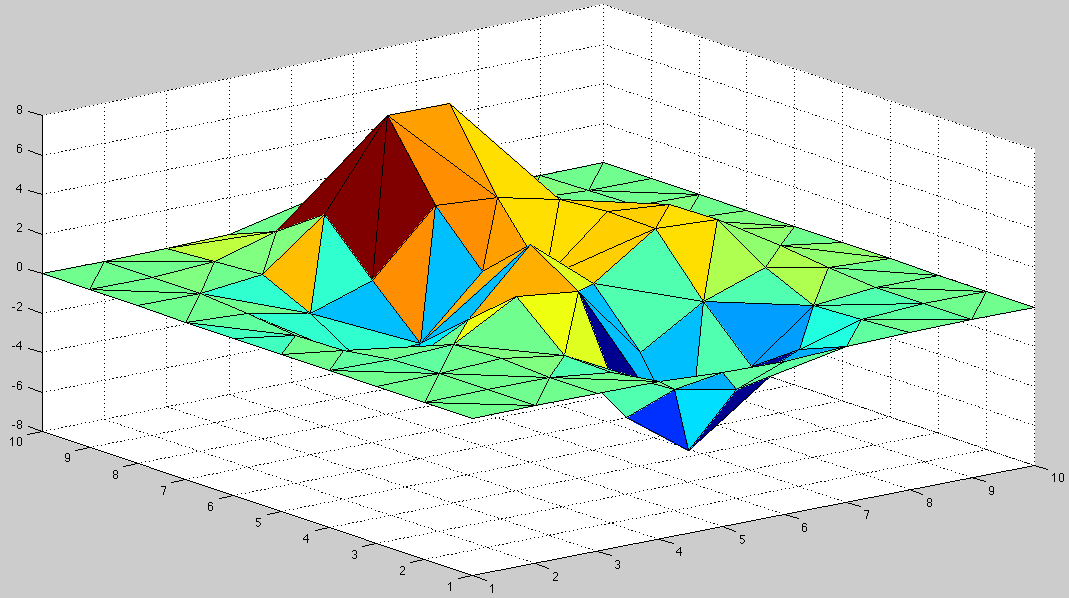
I can plot these normally with:
trisurf(F, V(:,1),V(:,2),V(:,3))
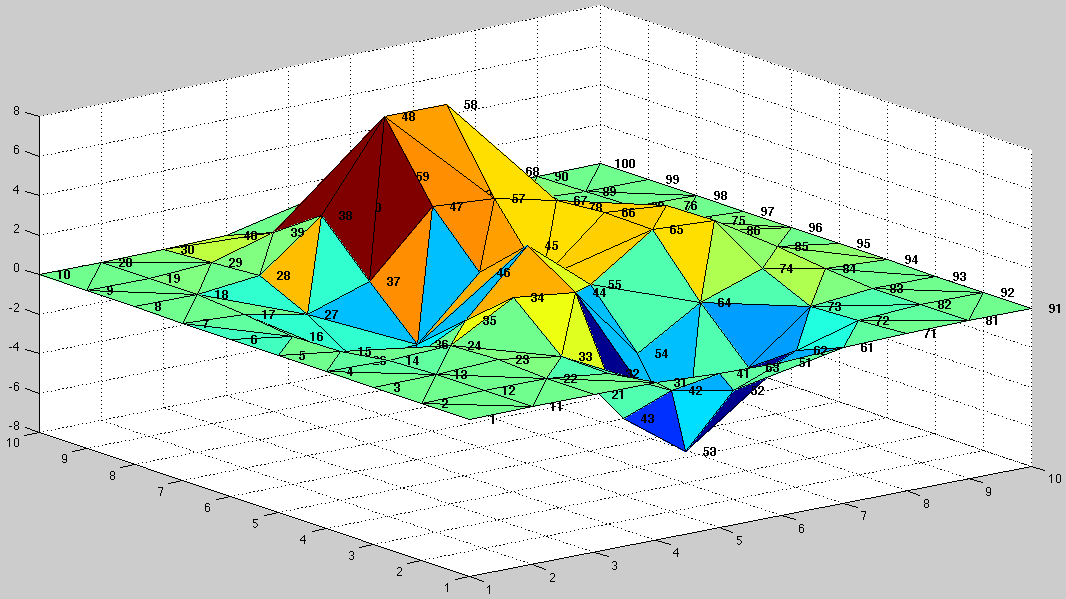
 I can create an array to hold the vertex indices, then plot the labels at corresponding points in 3d:
indices = 1:size(V,1);
text(V(:,1),V(:,2),V(:,3),num2str(indices'))
 And sometimes it helps to plot the labels in bold:
text(V(:,1),V(:,2),V(:,3),num2str(indices'),'FontWeight','Bold')
 Other times it is nice to push the labels off the vertex positions. Here I move them to the right a little:
text(V(:,1),V(:,2),V(:,3),[repmat(' ',size(indices',1),1) num2str(indices')],'FontWeight','Bold')