Display skeleton armature (graph of bones and joints) in matlab
Alec Jacobson
May 09, 2011
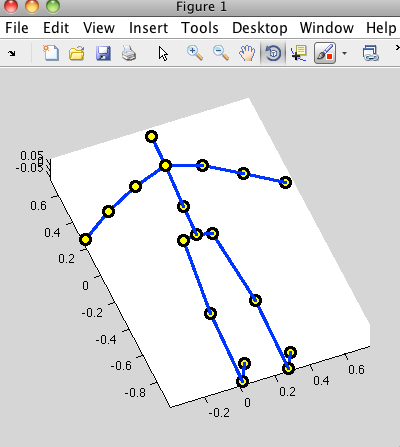 In Matlab if you store your joint vertex locations as row vectors in the matrix C, and you store your bones as endpoint indices in a matrix BE then you can display your skeleton with:
plot3( ...
    [C(BE(:,1),1) C(BE(:,2),1)]', ...
    [C(BE(:,1),2) C(BE(:,2),2)]', ...
    [C(BE(:,1),3) C(BE(:,2),3)]', ...
    '-bo', ...
    'LineWidth',2, ...
    'MarkerSize',8, ...
    'MarkerEdgeColor','k', ...
    'MarkerFaceColor','y');
axis equal;
Update:
Use this to add labels at each bone centroid:
CN = (C(BE(:,1),:) + C(BE(:,2),:))/2;
text(CN(:,1),CN(:,2),CN(:,3),num2str((1:size(CN,1))'),'BackgroundColor',[.8 .8 .8]);