Getting raw data from an image of a chart
Alec Jacobson
April 18, 2012
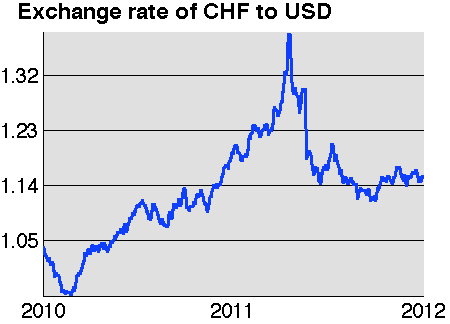
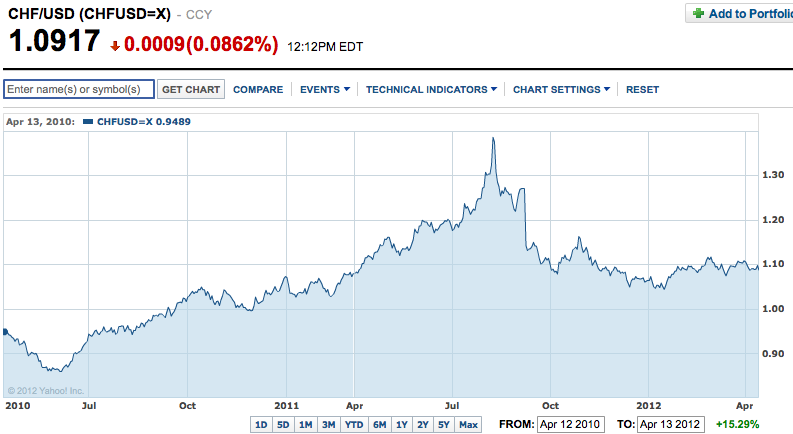
I found this chart of CHF to USD conversion rates over the last 730 days online, but couldn't easily find the data behind it:
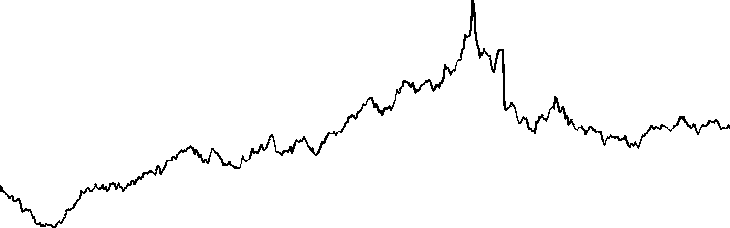
 So I grabbed a screenshot and applied some thresholding in photoshop to get an 730 pixel-wide image of the data line:
 Then using the following matlab calls I extracted the data:
im = imread('chfusd-04-2010-04-2012-thresh.png');
[I,J] = find(any(~im,3));
DM = sparse(I,J,size(im,1)-I);
D = max(DM);
minD = 0.96;
maxD = 1.39;
D = D/max(D(:))*(maxD-minD)+minD;
Which I can then replot any way I like: