Using matlab to visualize vector fields on triangle meshes
Alec Jacobson
July 29, 2013
I recently discovered the quiver function in matlab, which can plot vector fields. I use this to plot a the piecewise constant gradient of a scalar field Z defined on a triangle mesh (V,F) like this:
trisurf(F,V(:,1),V(:,2),0*V(:,1),Z,'FaceColor','interp','FaceLighting','phong','EdgeColor','none');
axis equal
view(2);
colormap(jet(20));
G = grad(V,F);
GZ = G*Z;
BC = barycenter(V,F);
hold on;
quiver(BC(:,1),BC(:,2),GZ(1:size(F,1)),GZ(size(F,1)+(1:size(F,1))),1.1,'k','LineWidth',1.5);
hold off;
My grad and barycenter functions compute a #F*dim by #V gradient operator and #F by dim matrix of triangle barycenters respectively. This produces something like: 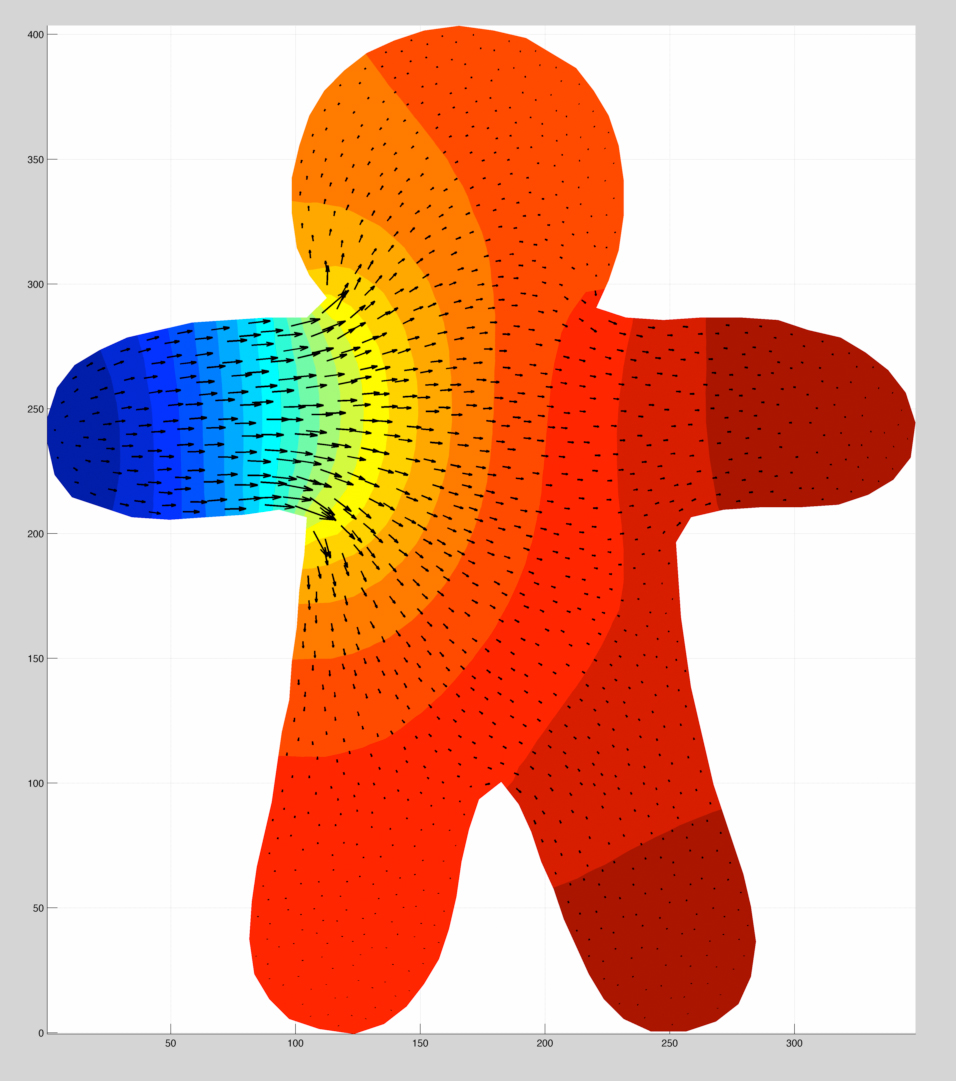 It'd be cool to visualize streamlines, too, but it seems like matlab's
 streamline function only works for grids.