Vector field with actual arrows
Alec Jacobson
August 11, 2013
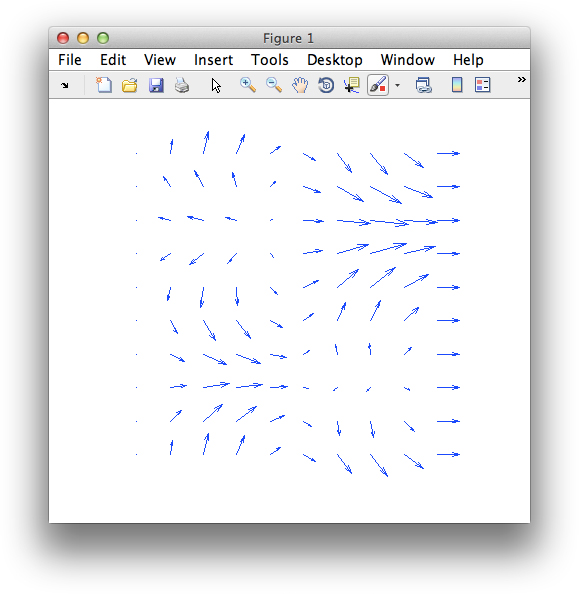
I recently discovered MATLAB's quiver function which produces visualizations of vector fields. This function creates "arrows" using three line segments. This is fine for prototyping, but not great for making nice images.
Here's an example using quiver:
[X,Y] = meshgrid(linspace(0,1,40),linspace(0,1,40));
U = sin(X*2*pi).*sin(Y*2*pi)+X;
V = sin(X*2*pi).*cos(Y*2*pi);
quiver(X,Y,U,V);
set(gca,'Visible','off')
set(gcf,'color','w')
which produces:
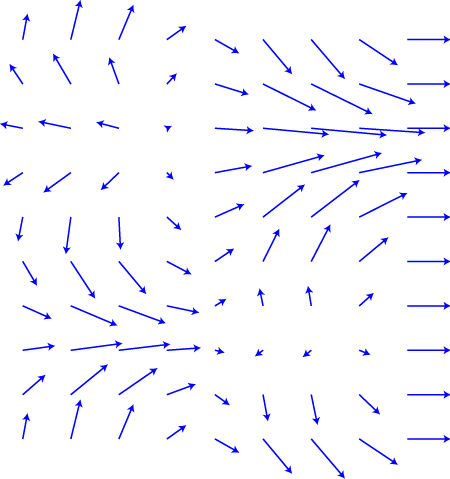
 Here's my updated pipeline for making nice images of vector field using MATLAB and Adobe Illustrator.
In Matlab:
Here's my updated pipeline for making nice images of vector field using MATLAB and Adobe Illustrator.
In Matlab:
% scale appropriately
s = 1e-1;
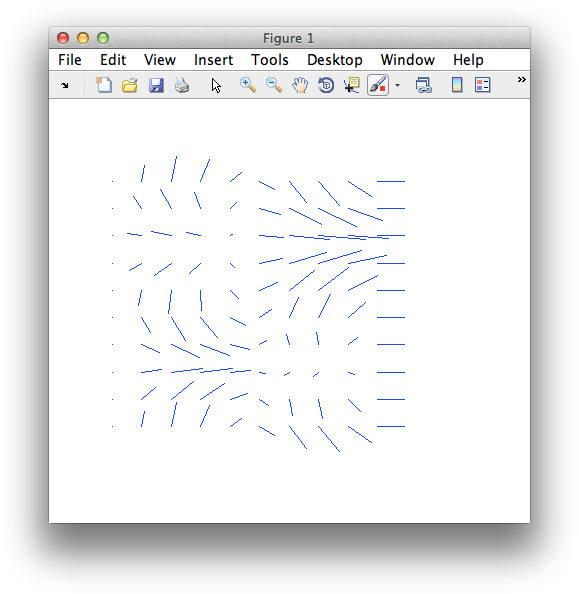
% plot just lines
plot([X(:) X(:)+s*U(:)]',[Y(:) Y(:)+s*V(:)]','-b');
set(gca,'Visible','off')
set(gcf,'color','w')
which produces:
 Save this as an .eps file and open it with illustrator.
Inevitably, matlab will have saved much more than just the line segments. Clean it up a bit. Select one of the "dot" markers (especially visible if any of your lines were very small). Then choose Select > Same > Stroke Weight. This will select all dots. Then hit Delete.
Now select one of the line segments and choose Select > Same > Stroke Weight. This will select all line segments. Now choose an appropriate arrowhead. This will produce something like:
Save this as an .eps file and open it with illustrator.
Inevitably, matlab will have saved much more than just the line segments. Clean it up a bit. Select one of the "dot" markers (especially visible if any of your lines were very small). Then choose Select > Same > Stroke Weight. This will select all dots. Then hit Delete.
Now select one of the line segments and choose Select > Same > Stroke Weight. This will select all line segments. Now choose an appropriate arrowhead. This will produce something like: