I'm often plotting scalar functions on surfaces using the trisurf routine of matlab. This has basic per-vertex, per-face coloring. And with some hassle you could even set up lights. Instead I've settled on a better way to convey the shape of the surface and the function by multiply the colors with the inverse of the mesh's ambient occlusion. I wrote a matlab wrapper mex function for our libigl function. Find it in libigl/examples/ambient-occlusion-mex (version ≥0.3.4). Once compiled you can call from matlab it like this:
S = ambient_occlusion(V,F,P,N,num_samples);
Where (V,F) is your triangle mesh, P are the evaluation points and N are the normals (defining a hemisphere).
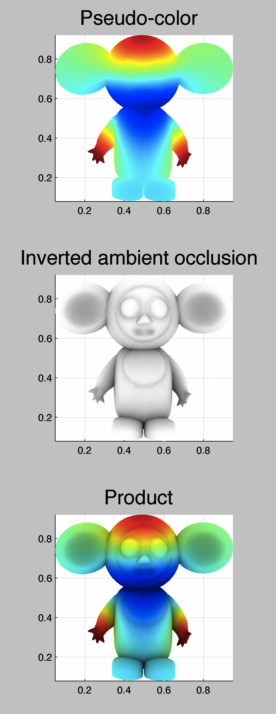
Here's an example of multiplying it against some pseudo-color values:
For computing ambient occlusion per-vertex and then applying it to per-vertex colors, use:
AO = ambient_occlusion(V,F,V,per_vertex_normals(V,F),1000);
tsurf(F,V,'FaceVertexCData',bsxfun(@times,(1-AO),C),fphong,'EdgeColor','none');
Update: If you have a scalar field and you'd like to visualize it using ambient occlusion on top of a pseudo-color, try:
tsurf(F,V,'FaceVertexCData',bsxfun(@times,1-AO,squeeze(ind2rgb(floor(matrixnormalize(Wbh(:,1))*256),jet(256)))),fphong,'EdgeColor','none');