In this and subsequent bar charts, bar widths are proportional to sample size.
Non-male identifying researchers, including women and non-binary individuals, are underrepresented in leadership roles within computer graphics conferences. Analyzing data on these roles over time across key conferences highlights this disparity, while also identifying positive trends and worrisome constants. The goal of the following data collection is to provide grounded statistics to inform future decision making. Recognizing even small successes from the past may inspire and accelerate future improvement. The academic community’s recent failure to sufficiently address sexual harassment and malevolent behavior from members of the community (e.g.1) is an urgent reminder to improve.
This is admittedly arm-chair statistics. Anyone with the internet could collect this data and create the following statistics and plots. Nevertheless, I’d like to be thorough about the methodology, which is largely replicating Graesser et al.2, who examined robotics conference leadership.
The most fraught aspect of this kind of data collection is the categorization of other people’s gender. I’ll purposefully refer to perceived gender to emphasize that this is not the result of self-reporting, which would have been better3. Gender is not binary. The primary goal of this data collection is to emphasize the enduring lack of non-male people in leadership roles at disproportionate rate compared to: society at large and some computer science undergraduate populations (e.g., ≈49% women at CMU4), though perhaps not computer science faculty populations (e.g., ≈24% of budgetary tenure-stream computer science faculty at University of Toronto) or computer graphics faculty populations (e.g., ≈15% of PhD-supervising, SIGGRAPH-publishing faculty in Canada).
Here, gender is categorized according to pronoun use. Only she/her (female), he/him (male) pronouns were encountered†. Pronoun categorization is imperfect: pronouns may be out of date, inaccurate, or insufficiently expressive. I’ll frequently refer to “non-male.” This is not to imply a male default, but rather to emphasize the disproportionate under-representation of all other groups relative to the dominant male group.
Each data point is the perceived gender of a person holding a leadership role at a graphics conference. The data is collected across a matrix of variables: conference × role × year. Six conferences are considered:
Three conference leadership roles are considered, collecting the typically most visible or high-profile roles of a conference:
Limiting to these few high-profile roles prevents saturation and diffusion of other – albeit interesting and important – roles (e.g., posters chair, technical papers committee, paper authors). The selected roles also carry fairly consistent prestige relative to their respective conferences. I specifically do not include “local organizing chairs” when a conference chair exists. Similarly, I do not include “Invited speakers” when higher-billed keynote speakers exist. For recent SIGGRAPHs, I do include the Conference Papers Co-Chair (or its equivalent). Importantly, the selected leadership roles are often accompanied with biographies on websites which reveal gendered pronouns.
The years 2010-2023 are considered. Every conference occurred in each year to some degree (many remotely during the COVID-19 global emergency; Pacific Graphics 2020 papers presented at the 2021 conference). This timespan reaches back far enough to observe multiple years in a row of multiple conferences with only perceived-male people taking on the leadership roles.
Finally, past conference websites are woefully under-maintained. Many are no longer directly available. The Wayback Machine has thankfully archived all of them.
Let’s get into it. Complete data is available as a published Google Sheet5. Out of:
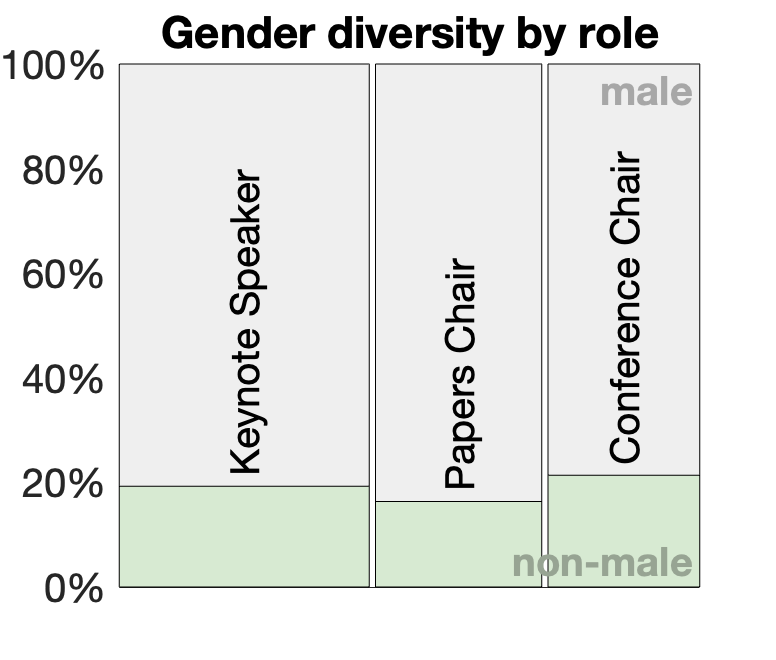
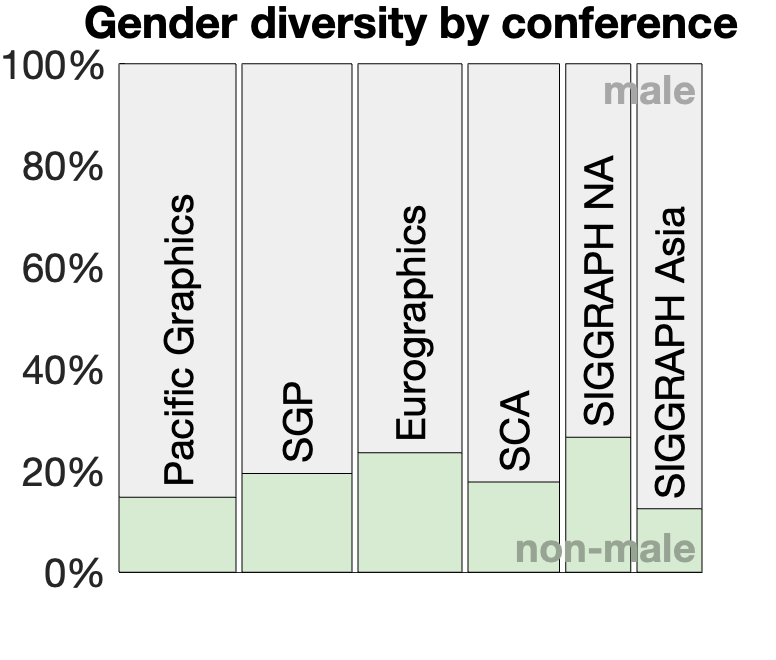
Across the six conferences totalling positions over all roles:
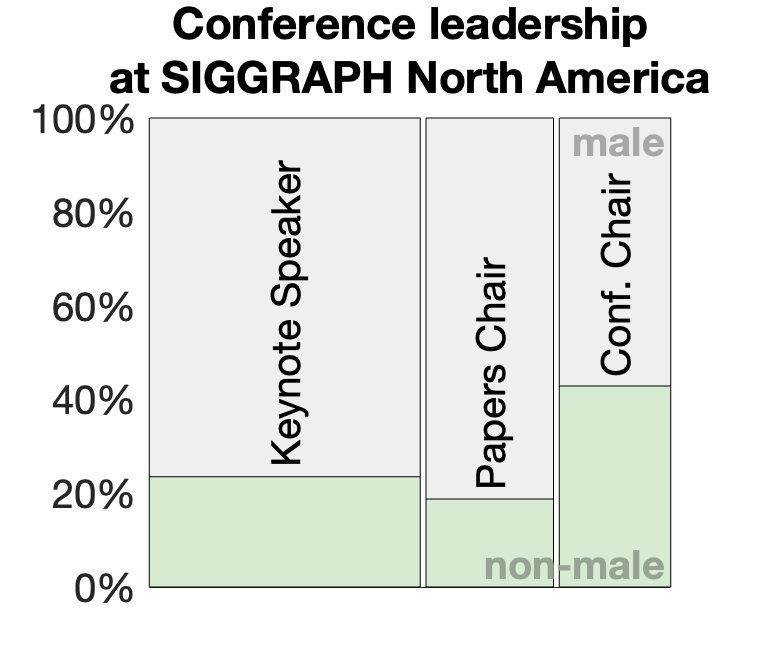
As SIGGRAPH North America stands out with the largest percentage non-male, let’s scratch further. At that conference, across roles we see:
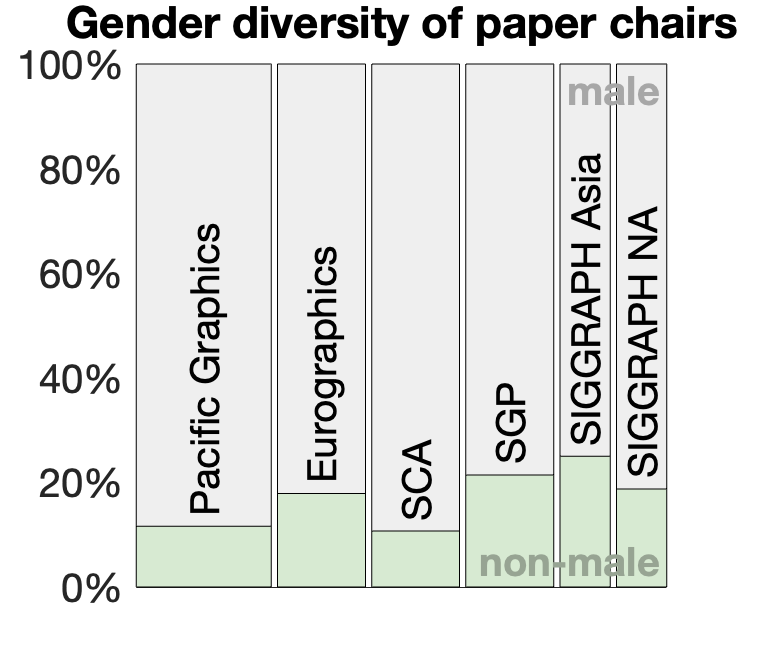
Meanwhile, papers chairs appear to have the least gender diversity. Looking across conferences we see:
The data collection also reveals a sense of how large (or small) the community’s leadership circle is. Out of the 543 total positions, there appear:
To get a sense of the seeming power-law distribution, the top 10 busiest unique names accounted for ≈10% of all the total positions. We saw above that 19% of positions are filled by non-male people, but see within this “busiest 10%” that it skews to 38% female. This supports the hypothesis that the same women are repeatedly asked to fill conference leadership roles. These roles are prestigious and recognitions of excellence, but also work; if gender diversity is achieved at the position level by tapping work from the same small group, it could be considered a diversity tax. For example, out of 162 papers chair positions, 17 perceived-female individuals account for all 26 occurrences when a non-male person filled the role.
| top 10 busiest individuals | |
| # positions | perceived gender |
| 11 | Male |
| 6 | Female |
| 5 | Female |
| 5 | Female |
| 5 | Male |
| 4 | Male |
| 4 | Female |
| 4 | Male |
| 4 | Male |
| 4 | Male |
Another way of looking at the distribution of positions to unique individuals is to take the average number of positions any one individual might have:
Yet another way to look at it, is to consider the percentage of unique individuals over the total number of positions filled by a given gender category:
We can visualize percentages of non-male positions at each conference (scattered dots) and their accumulation (black line) over the years in question. Especially obscured in this visualization is the abundance of “all-male leadership” conferences (0% non-male positions across conference chairs, papers chairs, and keynote speakers).
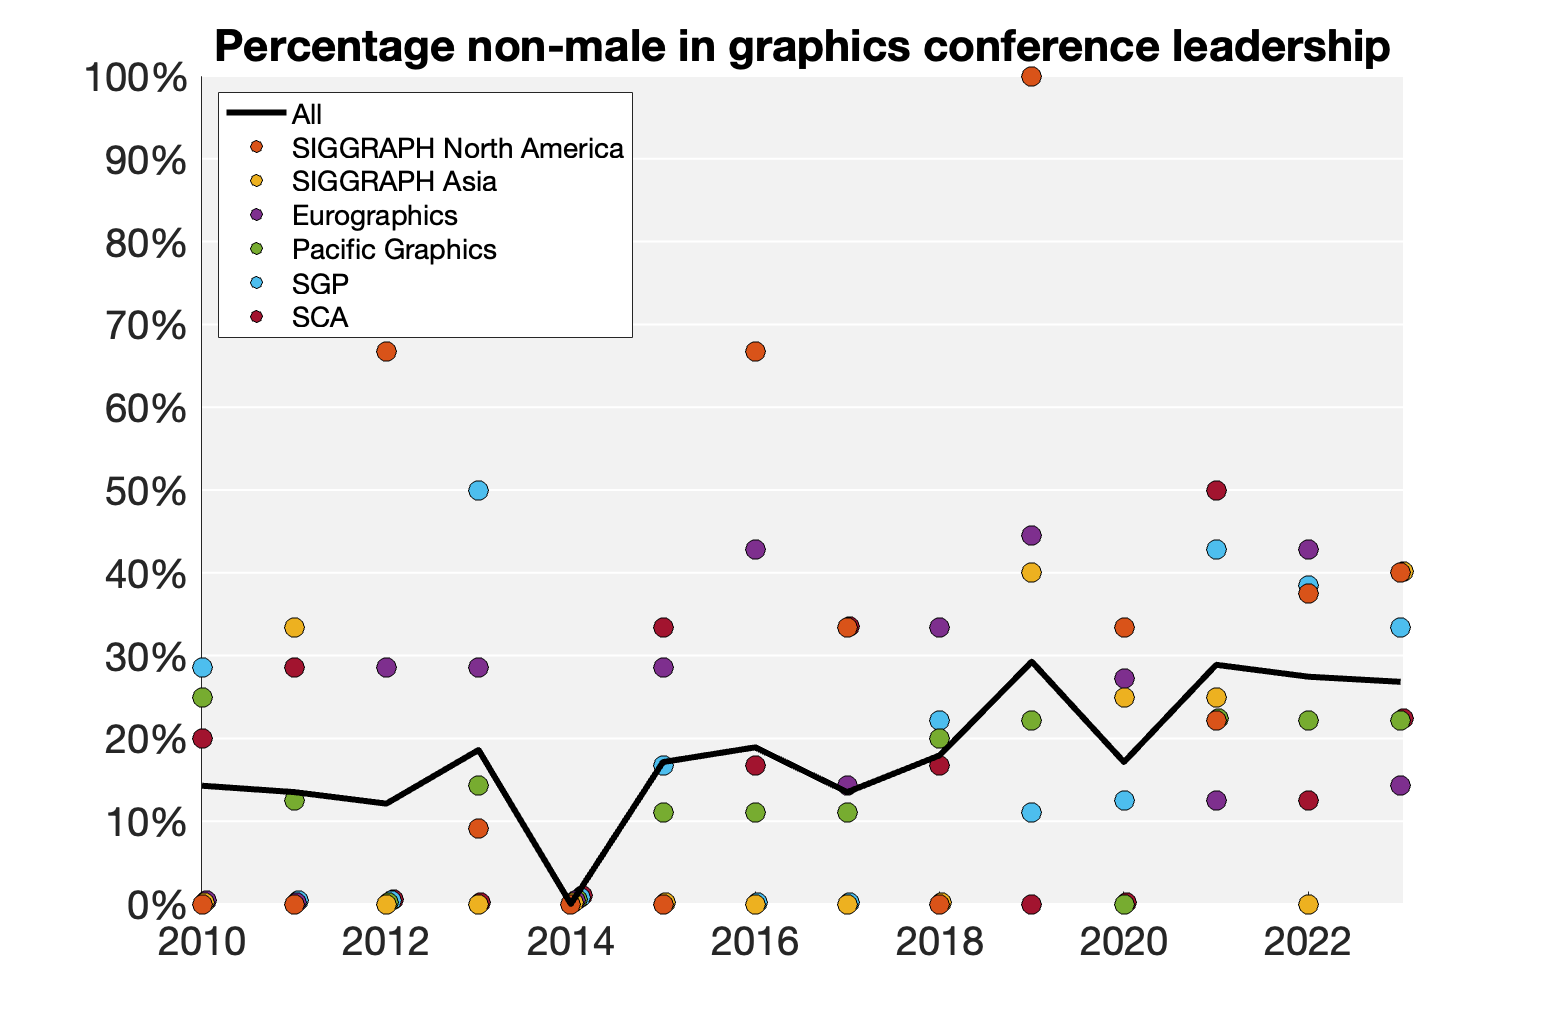
In 2014, all six conferences failed to fill a single position with a non-male person. All-male leaderships continue as recently as SIGGRAPH Asia 2022.
| All-male conference leaderships | |
| # recent years | conference |
| 9 | SIGGRAPH Asia |
| 5 | SIGGRAPH North America |
| 5 | Symposium on Geometry Processing |
| 5 | Symposium on Computer Animation |
| 3 | Eurographics |
| 3 | Pacific Graphics |
The total line in the visualization above does appear to show a positive trend over time. In the last few years it’s not clear whether that increase is continuing or stagnating.
In late 2017, the #metoo movement accumulated widespread media attention, intersecting with the graphics community directly when in early 2018 the Wall Street Journal reported on sexual harassment occurring at a past SIGGRAPH conference6.
In 2019, SIGGRAPH North America records the only “all-female” conference leadership. In that year, four conferences saw an increase in the percentage of non-male positions. All four decreased the next year.
Paper and/or conference chairs typically (help) select keynote speakers for a conference. A reasonable hypothesis is that all-male-chaired conferences are more likely to produce all-male keynote lineups. We can test the corresponding null hypothesis: "having at least one non-male chair is independent of having at least one non-male keynote speaker." The contingency table for our data is:
| all-male keynotes(s) | ≥1 non-male keynote | |
| all-male chair(s) | 29 | 9 |
| ≥1 non-male chair | 26 | 19 |
To approach the diversity of our student and societal populations, the graphics community must continue to increase the number of non-male individuals in conference leadership positions. We should stop hosting conferences with all-male leaderships. By increasing the diversity of conference and paper chairs, we may also help increase the diversity of keynoters. We should train a more diverse community of researchers and put a larger number of unique individuals into leadership roles. We should also increase the number of non-binary individuals in conference leadership positions. My data’s imperfect categorization muddies the comparison, but zero perceived non-binary individual out of 386 (0%) is, of course, less than general population percentages found in surveys (e.g., 1.6% in the U.S.A.7).
Focusing solely on gender – as this data and discussion does – may steal much-needed attention from other gaps in representational diversity. Similarly, focusing on representational diversity may steal attention from other inclusivity problems within the graphics community. So, perhaps the final conclusion is to get out of the armchair and take action.
1 “O'Brien v. The Regents of the Univ. of Cal.”, No. A164481 (Cal. Ct. App. Jun. 29, 2023)
2 Laura Graesser, Aleksandra Faust, Hadas Kress-Gazit, Lydia Tapia, Risa Ulinski, "Gender Diversity of Conference Leadership", in IEEE Robotics & Automation Magazine, 28(2), pp. 126-130, June 2021.
3 Ana Dodik, Silvia Sellán, Theodore Kim, Amanda Phillips, “Sex and Gender in the Computer Graphics Research Literature,” SIGGRAPH North America Talk, 2022.
4 Carol Frieze and Jeria L. Quesenberry. 2019. How computer science at CMU is attracting and retaining women. Commun. ACM 62, 2 (February 2019), 23–26.
5 “Gender Diversity of Conference Leadership in Graphics Data,” 2023.
6 Melissa Korn. “Allegations of Groping, Lewd Comments and Rape: Academia’s #MeToo Moment,” The Wall Street Journal, Jan. 11, 2018.
7 Anna Brown, “About 5% of young adults in the U.S. say their gender is different from their sex assigned at birth”, Pew Research Center, June 7, 2022
†At the time of first publishing, I did encounter one instance of they/them (non-binary) pronouns, but since then was directly informed to update to she/her. While I can't promise to maintain this dataset indefinitely or perfectly, I will always strive to update individuals' entries upon directy request.
This blog post originally appeared as a published google doc. An abbreviated version will appear as a SIGGRAPH North America 2024 Talk Abstract. I am grateful for the feedback of Annie Ytterberg, Colin Raffel, Jacqueline Smith, Yotam Gingold, and the anonymous SIGGRAPH reviewers.